SVG is an amazing technology which I regularly use for icons and occasionally for logos and illustrations. I’ve also dipped my toe into animated SVG. But if I’m honest I still find some SVG concepts confusing so I’ve gathered some useful tips here for future reference. Note: this is a living document which I’ll expand over time.
Table of contents
- Introduction to SVG
- Canvas, viewport and viewbox
- Arranging elements on a grid
- Inline SVG for icons
- Choose an SVG embedding technique that suits the task
- Choose the best-performing format
- Exporting and optimising SVG in design tools
Introduction to SVG
It’s an image format (like jpg and png) but also an XML-based markup language. So it’s a bit like HTML in that you can “compose a whole from a bunch of parts” – but it is focused on graphics. As a web graphics technology it has many benefits, for example:
- scalable,
- manipulable by CSS and JS,
- has a small file-size if well-optimised, and
- can be made accessible.
- It’s built for drawing in a way HTML and CSS are not.
- It can guide users, reduce their cognitive load, and provide personality and moments of fun.
Here’s a classic example: Log-in Avatar
Canvas, viewport and viewBox
Let’s break down the key elements of the SVG coordinate system.
Canvas
The canvas is the area where the SVG content is drawn. It’s infinite in both dimensions therefore the SVG can be any size.
Viewport
Although the canvas is infinite, the SVG is rendered on the screen relative to a finite region known as the viewport. Areas of the SVG that lie beyond the boundaries of the viewport are not visible. This is similar to a browser viewport. On a long page you don’t see all the content; just a portion of it.
Specify the viewport size by giving your <svg> element a width and height, e.g.:
<svg width="600" height="400">
  <!-- svg content -->
</svg>
We could specify units (such as em or px) but don’t need to. Unitless values are regarded as being set in user space using user units which effectively equate to pixels so our example above renders a 600px by 400px viewport.
The width of the viewport can also be set in CSS. Setting width:100% makes the SVG viewport fluid in a given container.
Viewbox
The viewport coordinate system starts at the top left (0, 0) corner of the SVG viewport. The user coordinate system is by default identical to that of the viewport, starting in the same place and with equal dimensions and units, however it can be modified using the viewBox attribute.
viewBox takes a value in the format: x y width height. The first two values set the upper-left corner of the viewbox and the second two its dimensions.
You can set the aspect ratio of the viewbox to the same as for the SVG viewport, or differently.
You might (optionally) use the viewBox attribute to transform the SVG graphic by scaling or translating it, or to crop it.
Specifying a smaller viewbox than viewport results in cropping the graphic to those dimensions and then zooming it in i.e. scaling it up so that it fills the entire viewport area.
Arranging elements on a grid
Cassie Evans recommends that when planning an arrangement of elements it’s nice to start with a simple grid using nice round numbers such as 100×100 – per the following <svg> – making it easy to then plot elements on top. You might even start by sketching with paper and pencil.
<svg viewBox="0 0 100 100">
  <!-- svg content, perhaps <rect>s -->
</svg>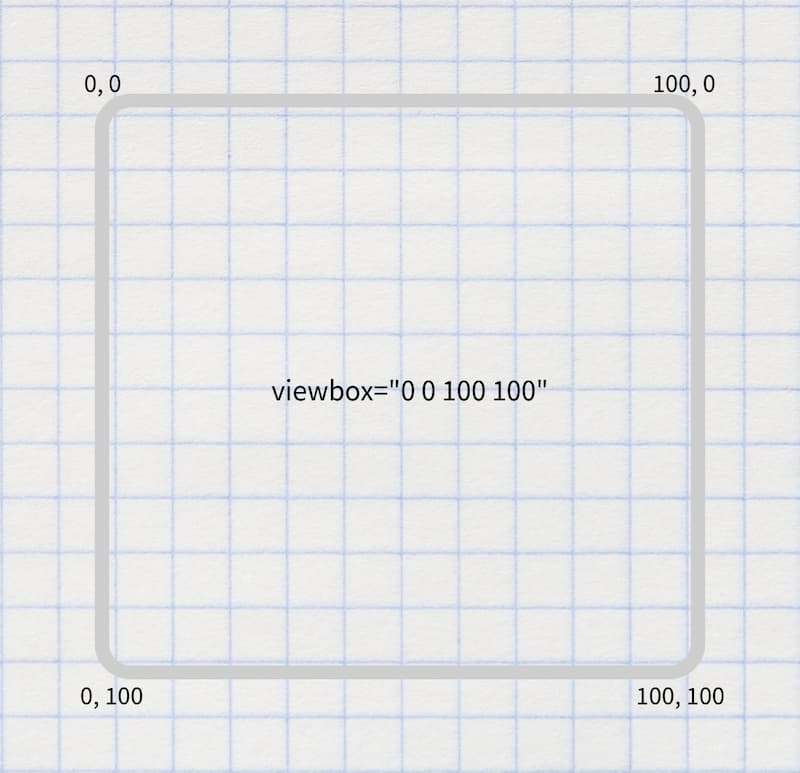
Inline SVG for icons
Having tried various icon systems including using <symbol> and <use>, Chris Coyier advocates that it’s perhaps simpler and better to just include the icons inline. Perhaps use the appropriate include technique for your stack to keep the code maintainable.
Choose an SVG embedding technique that suits the task
There are a variety of flavours and uses of SVG, including:
- icons
- infographics
- illustrations
- SVG that include text
- SVG that include animation.
As Sara Souidean covers in her talk “A Smashing Case Study”, your choice of SVG embedding technique depends on the nature of the project and the specific use case.
To do: summarise Sara’s technique for SVG with illustration and accessible text.
Choose the best-performing format
When you’re tasked with coding an illustration-based image, it’s tempying to automatically see that as a job for SVG. However keep in mind that for some images the SVG file size will be massive and PNG will perform much better, so compare the two options.
Exporting and optimising SVG in design tools
To export an SVG in Figma, right-click it (or select it on the left hand side) then select “copy as SVG”. There’s also an “export as SVG” option on the right.
References
- Understanding SVG Coordinate Systems by Sara Soueidan
- Swipey image grids by Cassie Evans
- A pretty good icon system by Chris Coyier
- A Smashing Case Study recorded presentation by Sara Souidean